Physical Address
304 North Cardinal St.
Dorchester Center, MA 02124
Physical Address
304 North Cardinal St.
Dorchester Center, MA 02124

Discover the first principle of technical analysis—alternating trends and trading ranges. Learn how to avoid pitfalls and optimize strategies for each market phase.
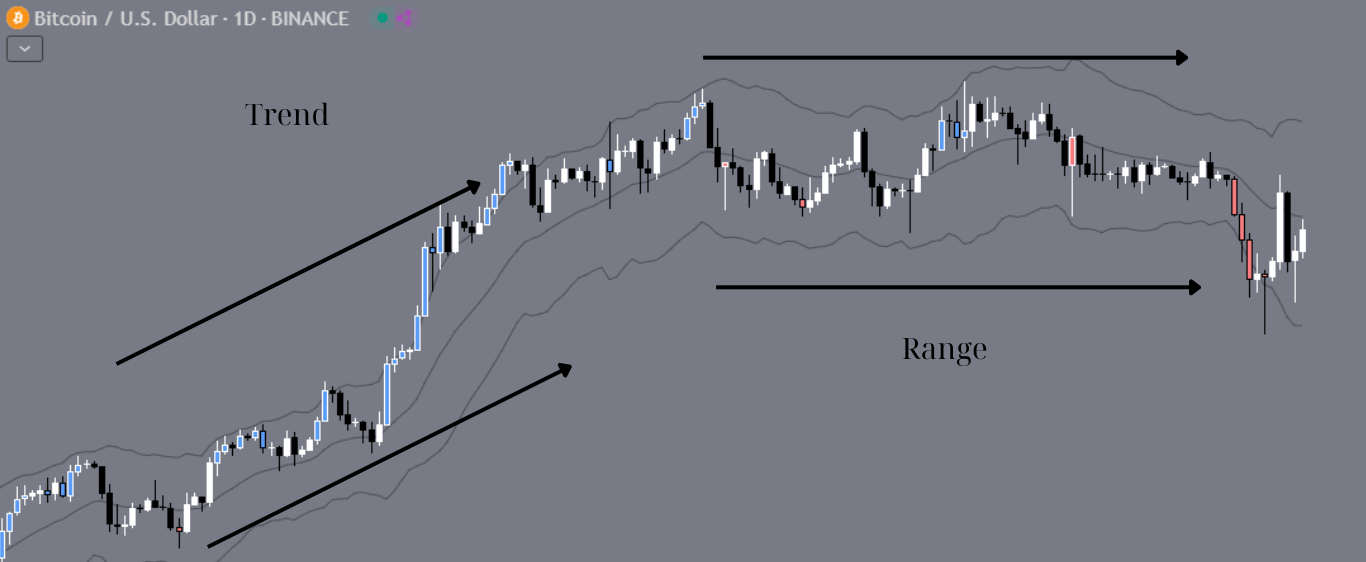
Technical analysis hinges on recognizing market phases: trends and trading ranges. Misjudging these phases leads to costly errors, as strategies effective in one phase often fail in the other. Here’s how to decode these critical market behaviors for smarter trading.
In trading ranges, markets oscillate between potential support and resistance levels. Key traits include:
But beware—false breakouts can lure traders into countertrend positions. For example, a resistance breach might signal a new uptrend or simply expand the range slightly. Adaptability is key.
While selling at resistance and buying at support seems straightforward, risks abound:
Pro Tip: Use confirmation signals (e.g., volatility measure methods, candlestick patterns) to validate breakouts before committing.
A trend isn’t just directional movement—it’s a sustained shift driven by market sentiment. Successful traders:
Market transitions are chaotic, marked by volatility, fakeouts, and erratic price action. To survive:
Did You Know? Over 60% of trading losses occur during misjudged transitions. Mastery here separates pros from amateurs.
Q: How do I identify a market transition?
A: Monitor volatility, volume shifts, and failed support/resistance tests.
Q: Can algorithms detect market phases?
A: Yes, but human intuition remains vital for interpreting noisy data.
Up Next: The Second Principle of Market Behavior—Trends Are More Likely to Continue Than Reverse.
Ready to refine your strategy? Bookmark this guide, and share your transition-trading tips below!